
About
Sharp Electronics-Load Cell And Weighing Machine Manufacturers in Pune India
Load Cell Manufacturers And Weighing Machine or Weighing Scale Manufacturers in Pune, Mumbai, Chakan, Bhosari, Talegaon, Ranjangaon, Pirangut, Shirwal, Supa, Baramati, Raigad, Taloja, India|Sharp Electronics
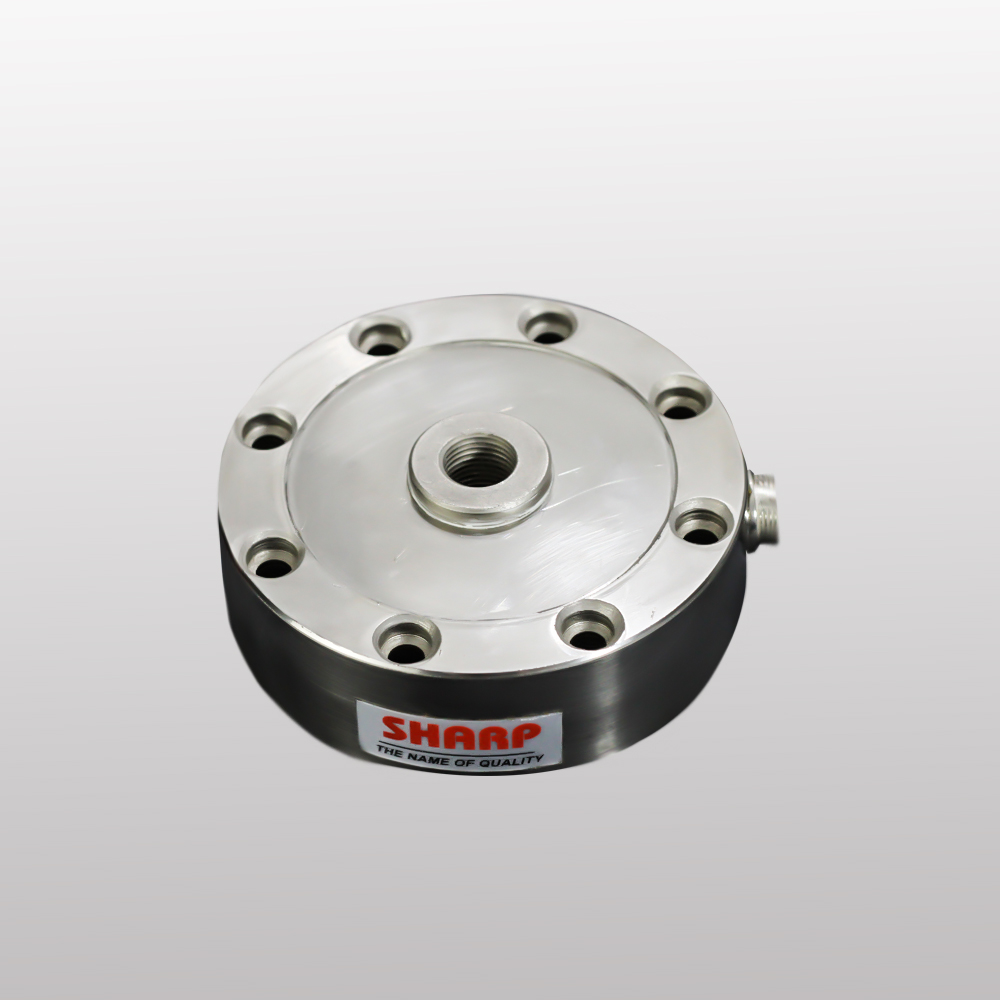
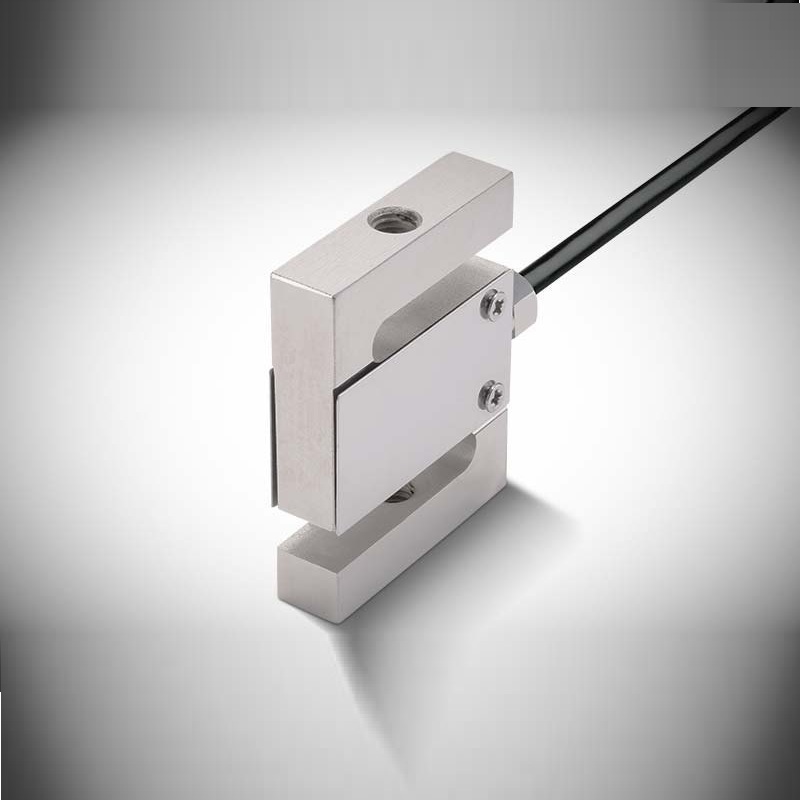
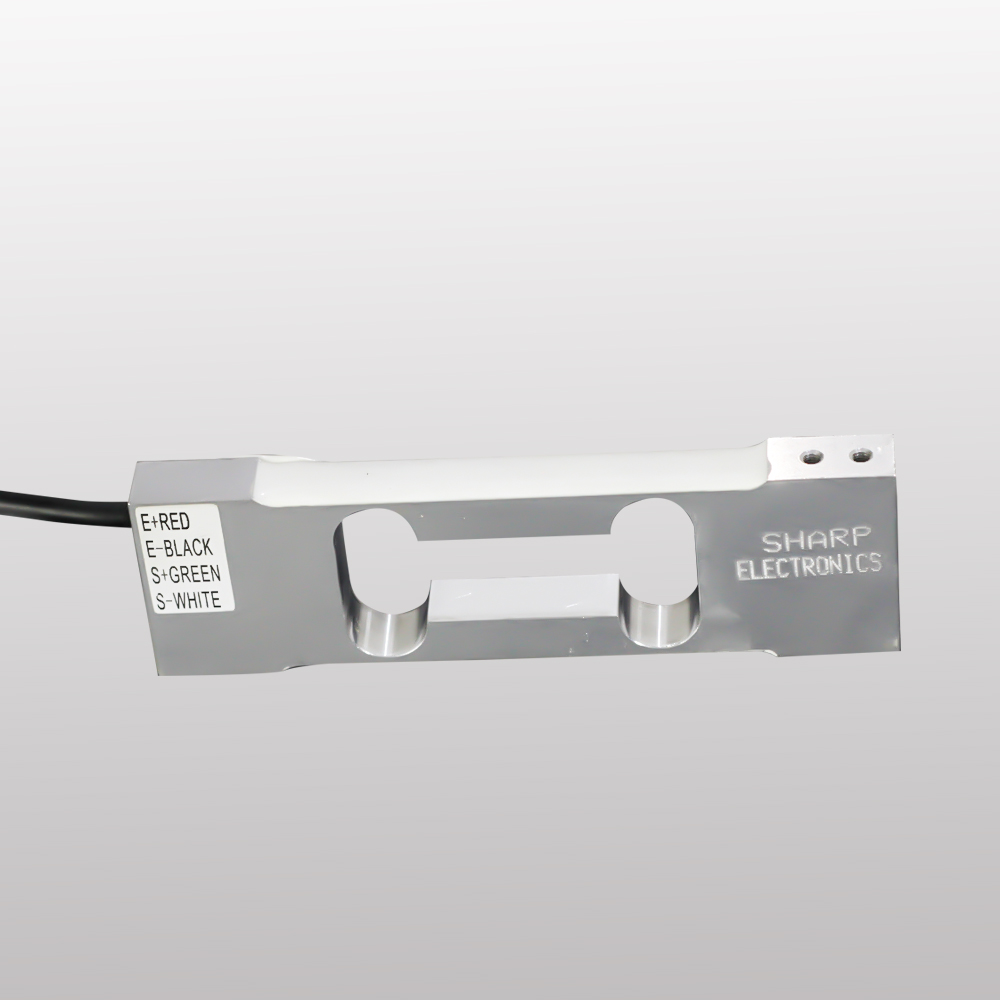
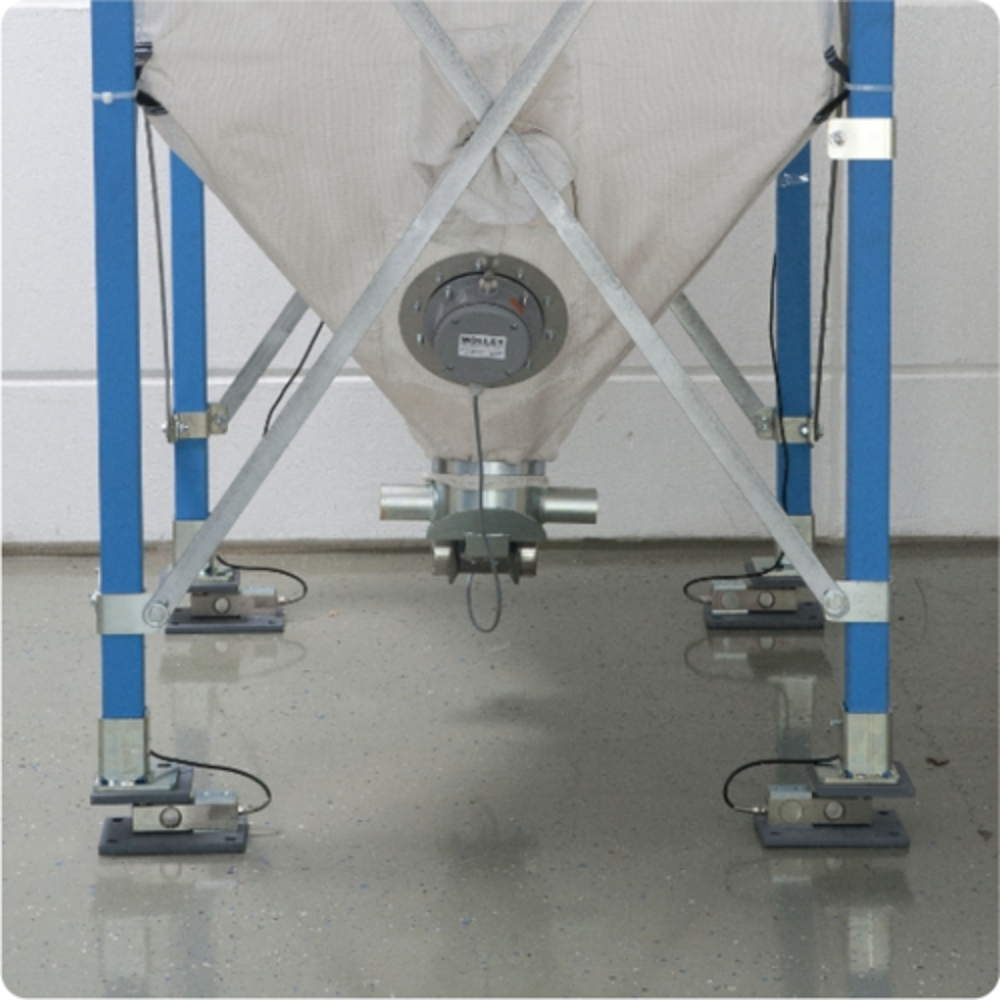
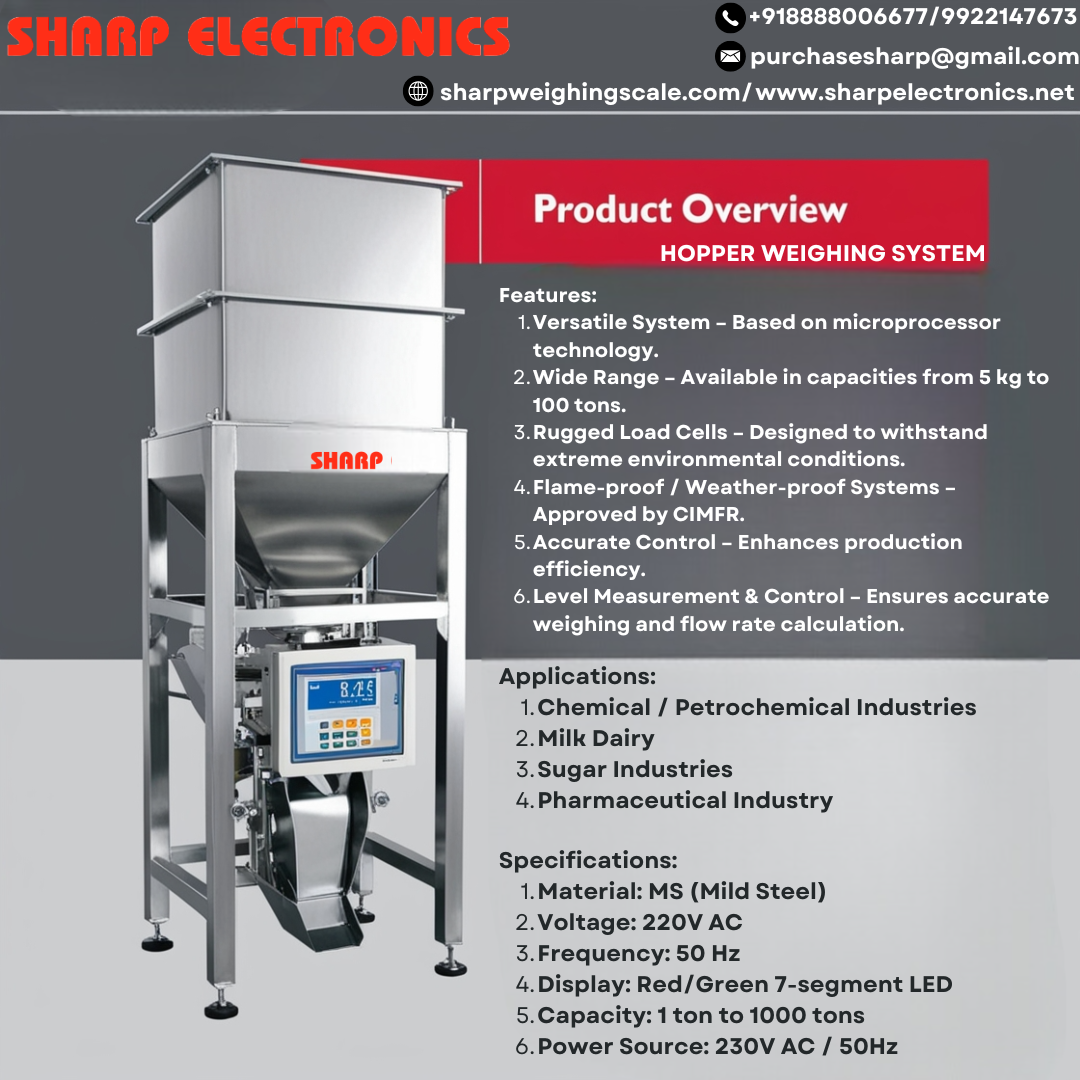
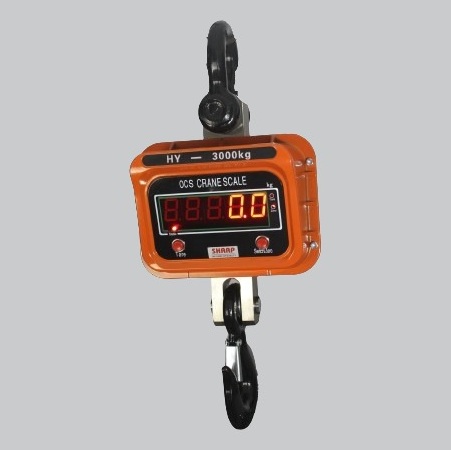
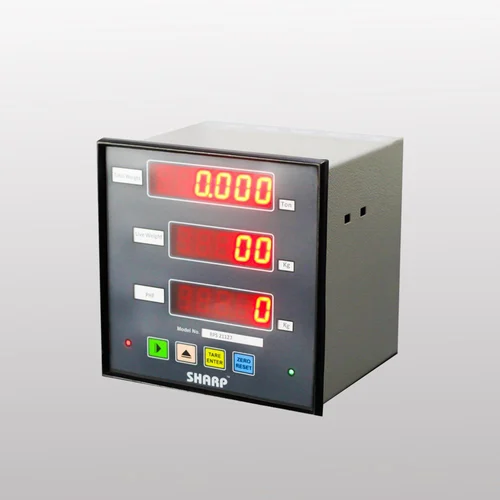
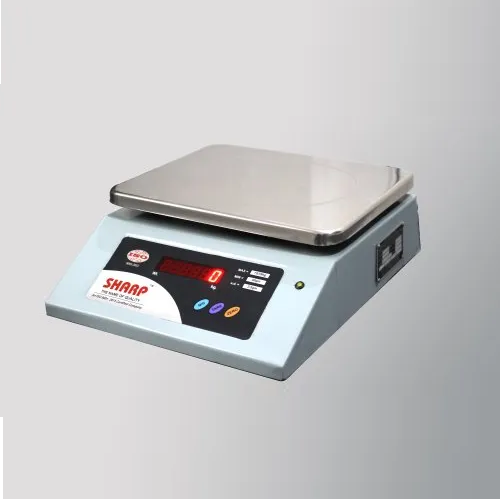
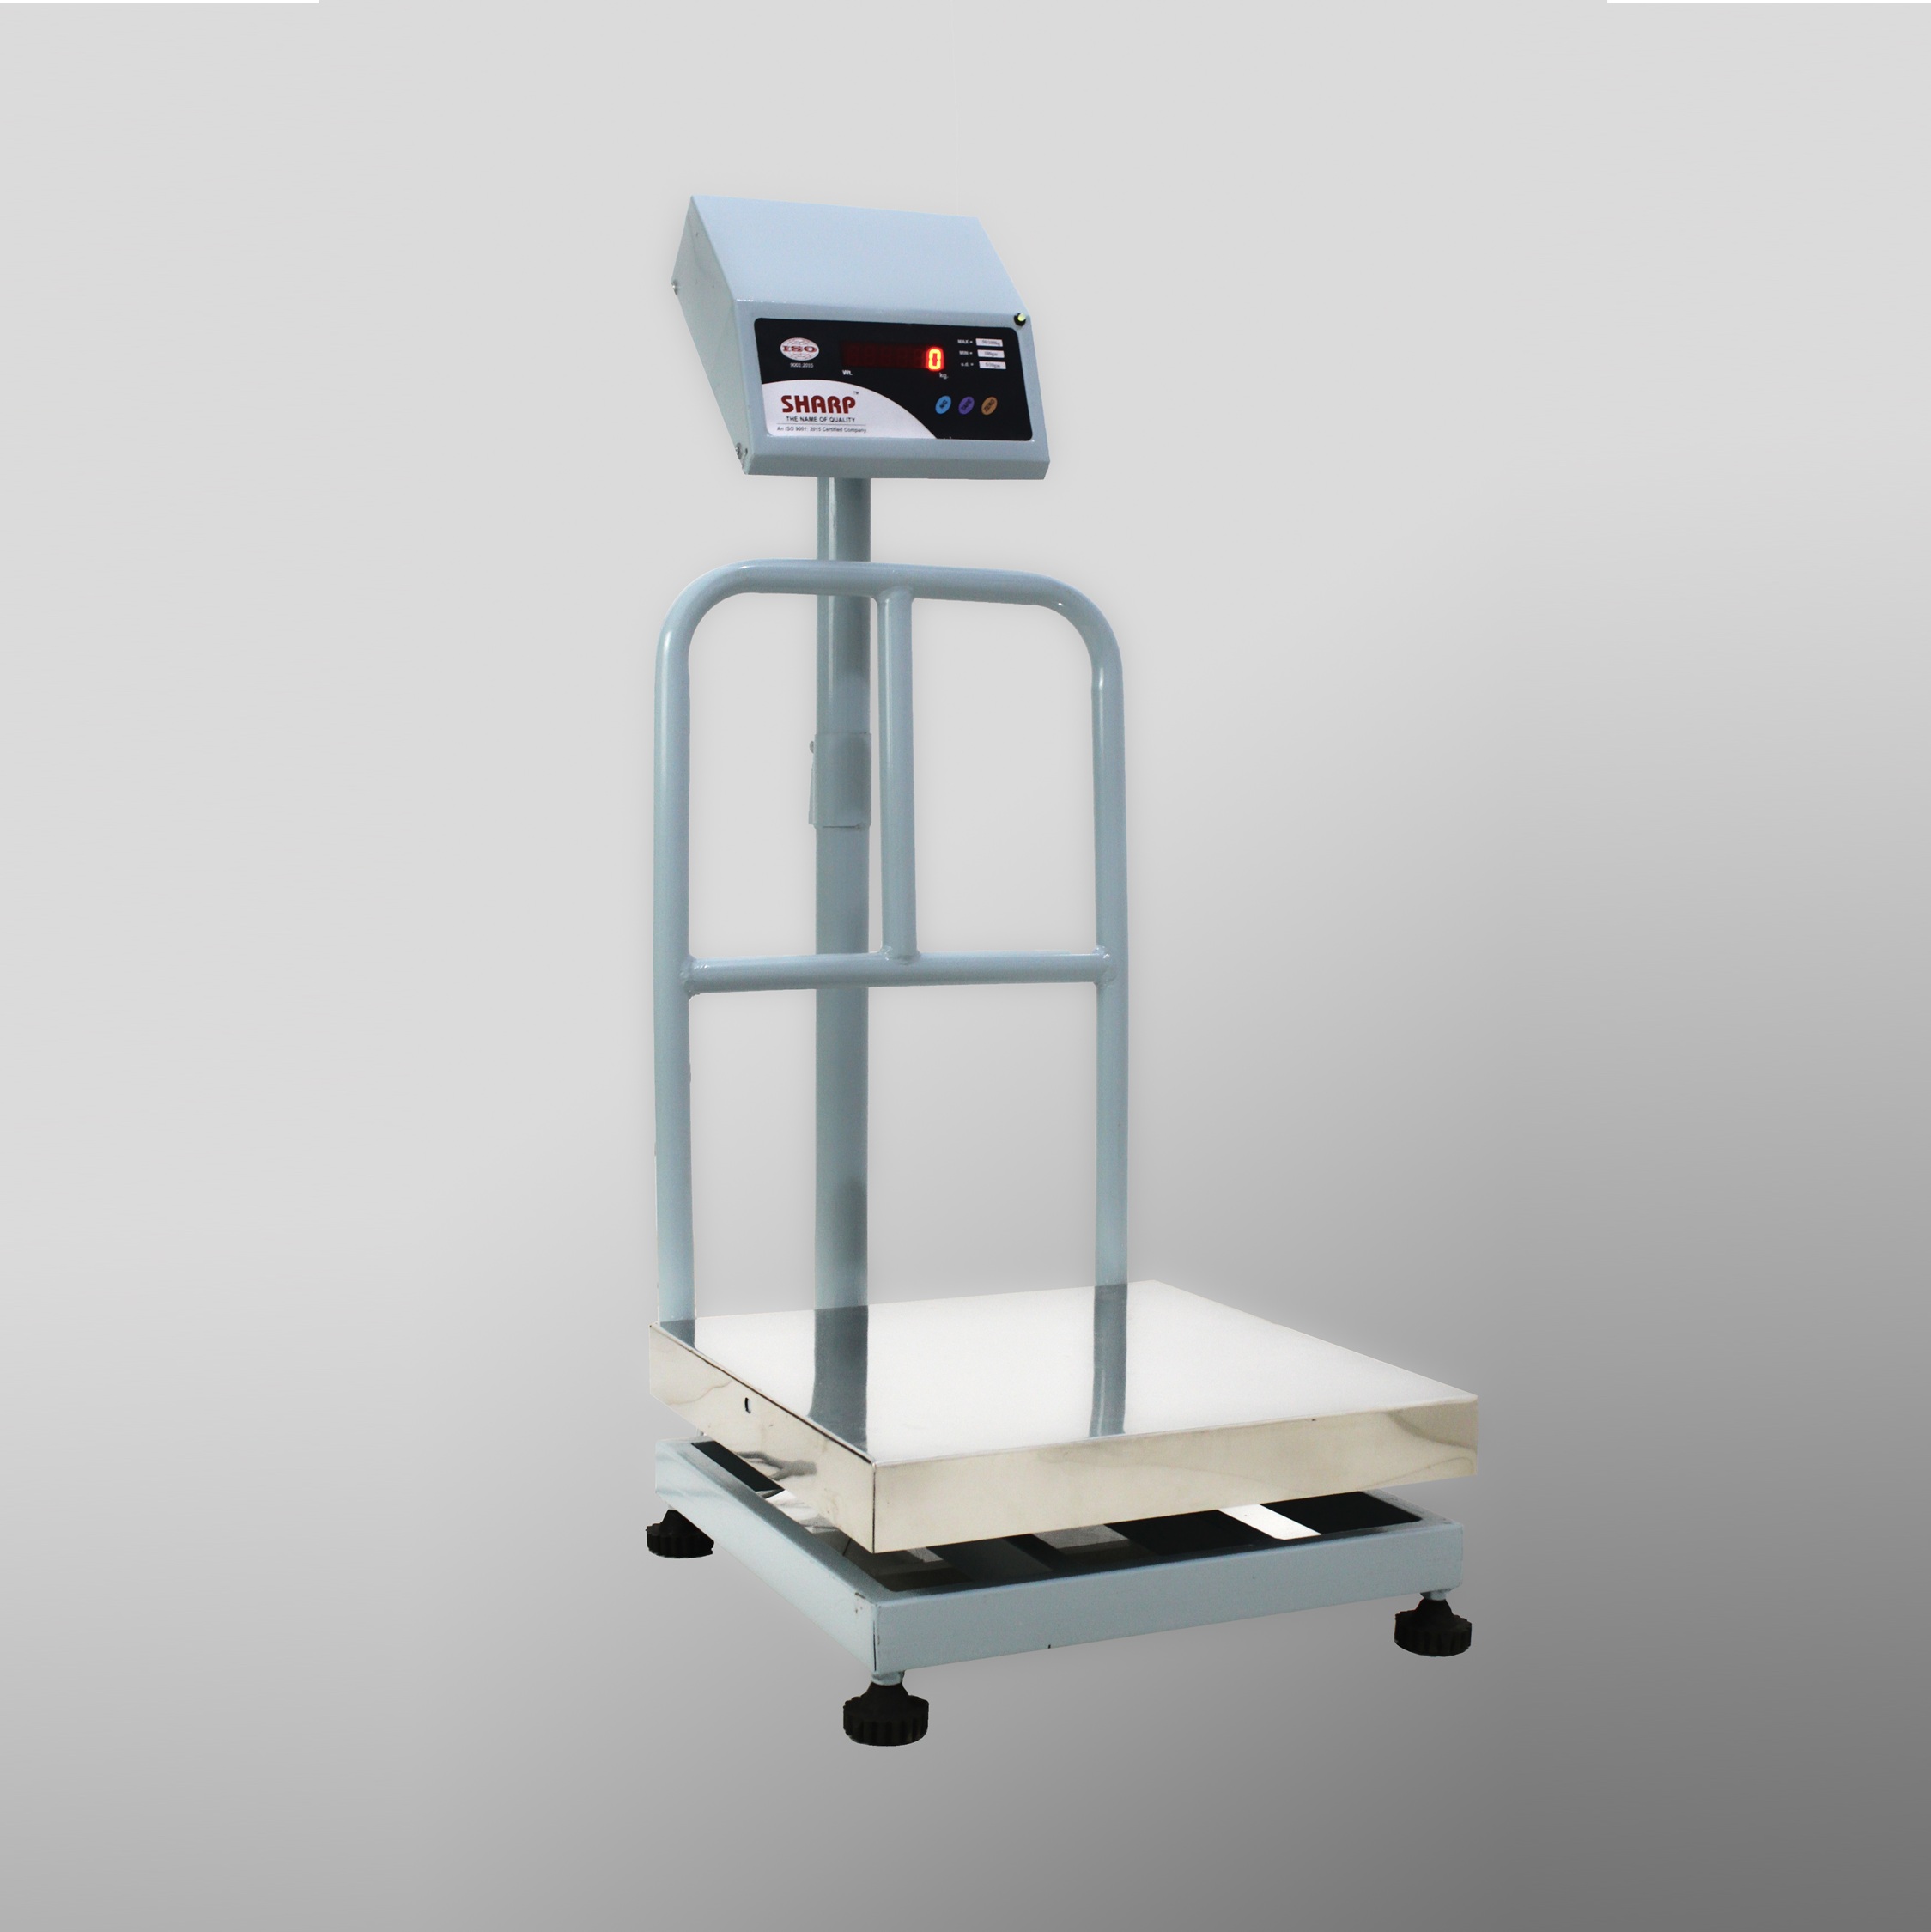
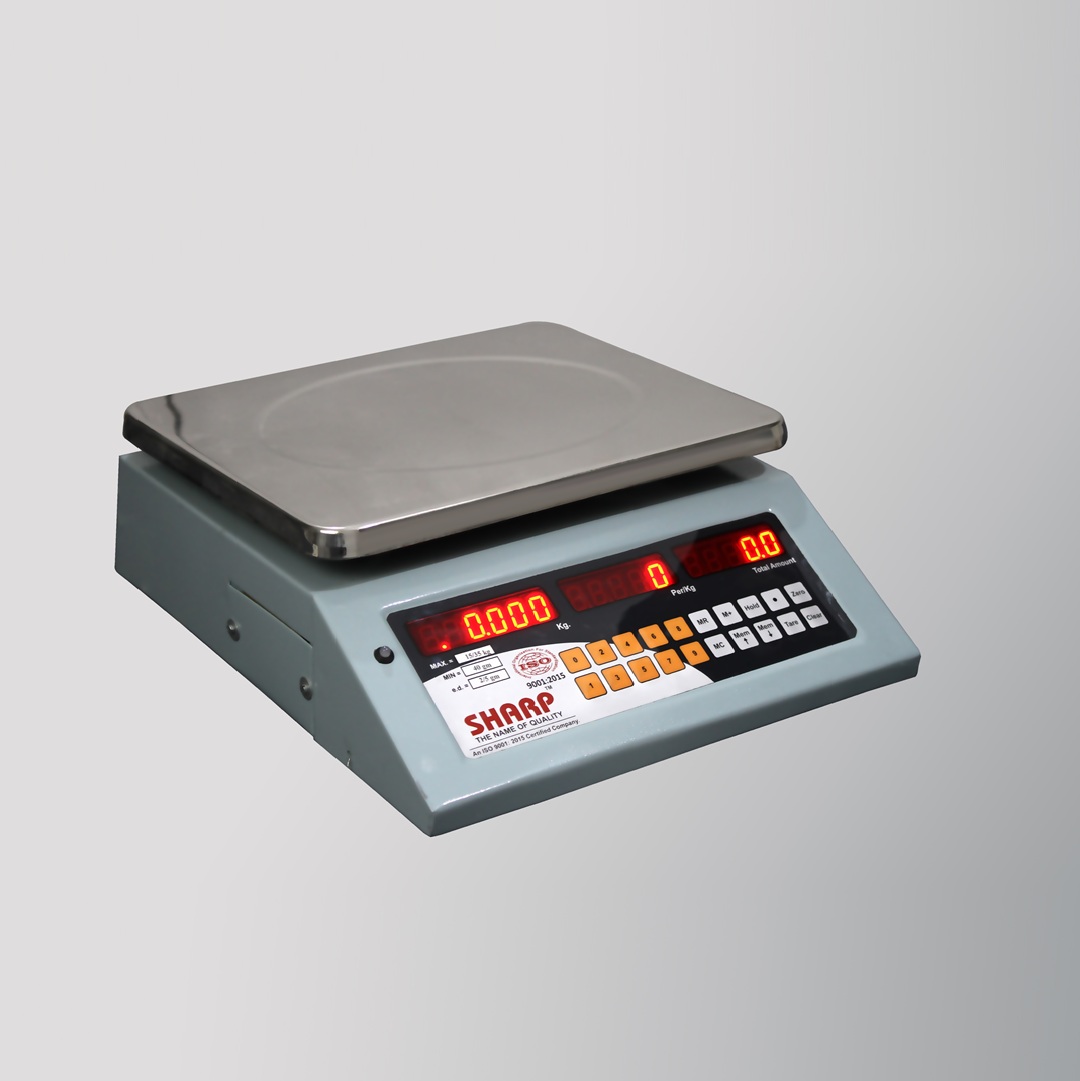
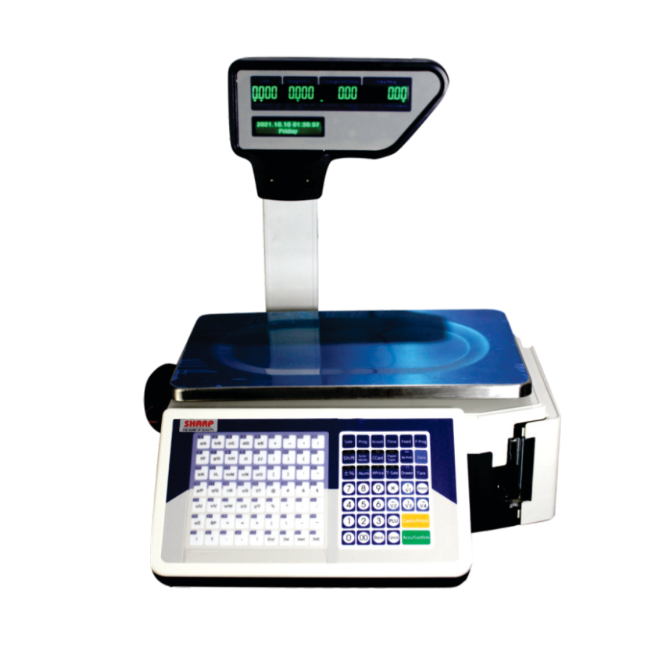
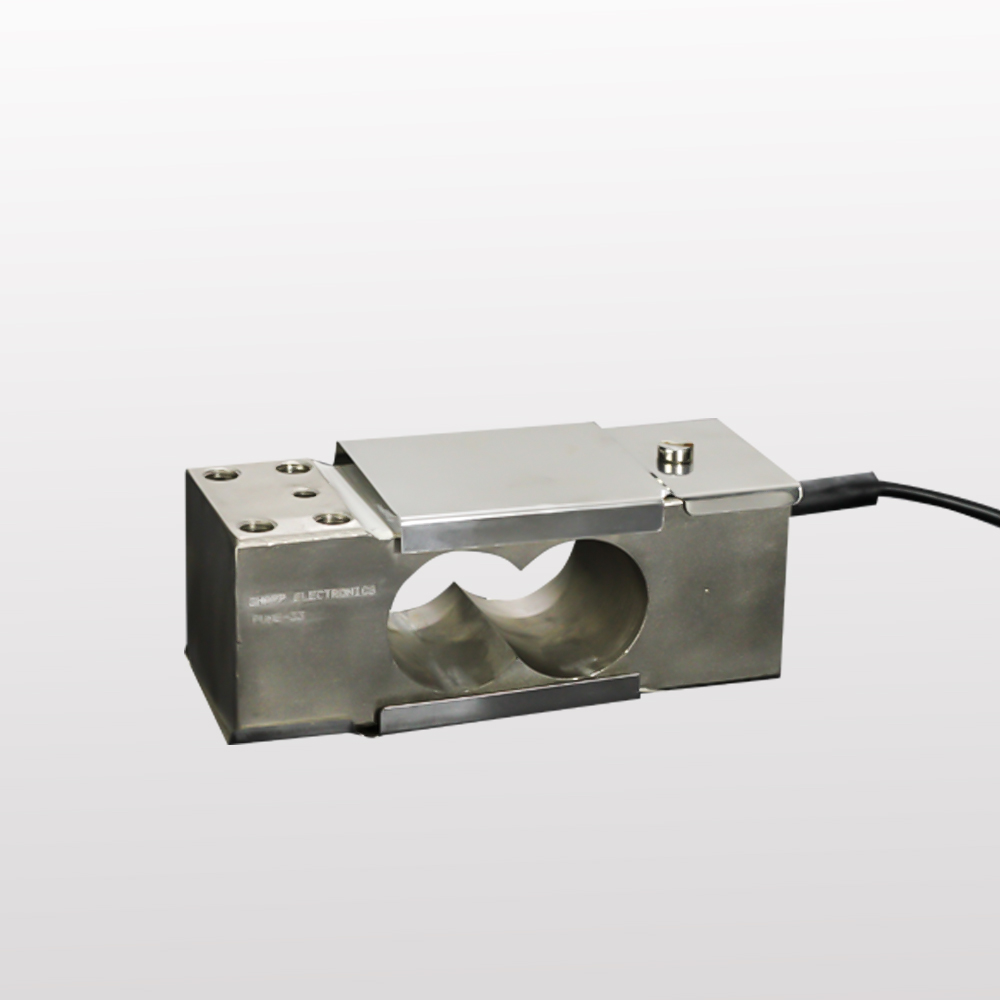
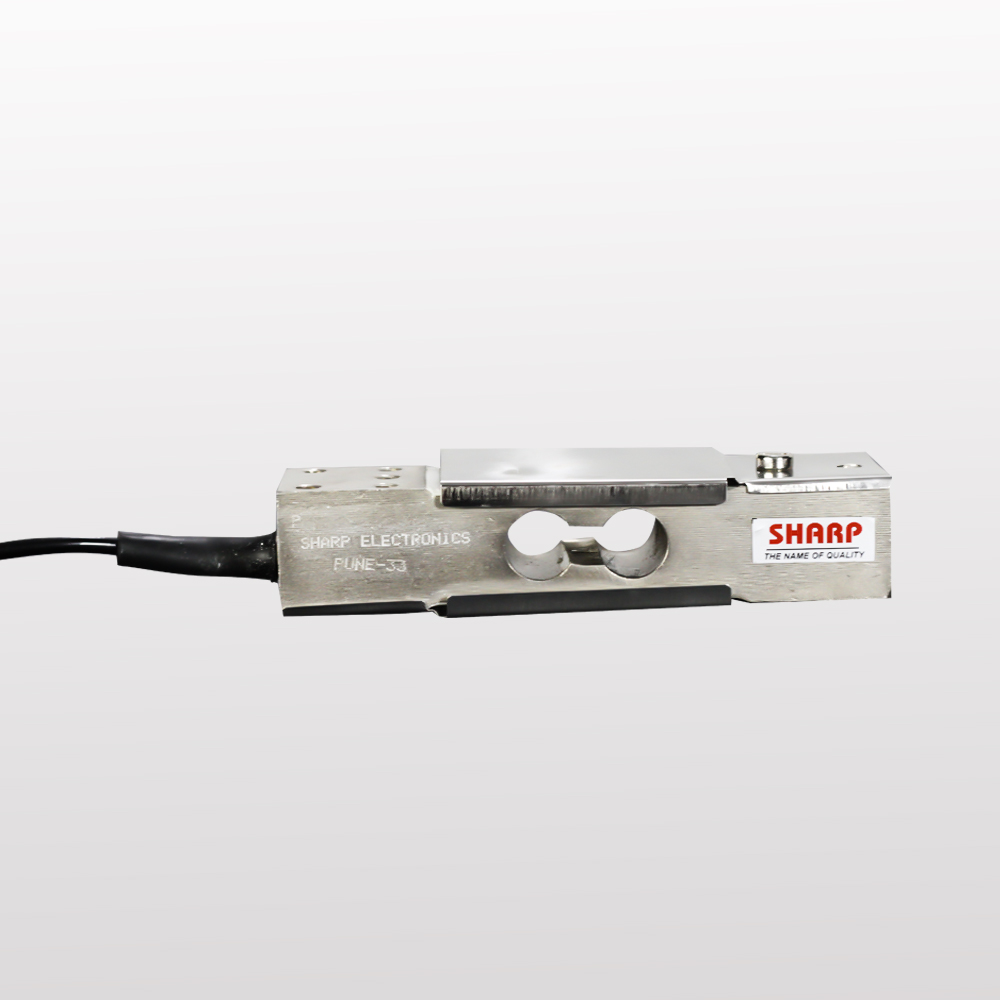
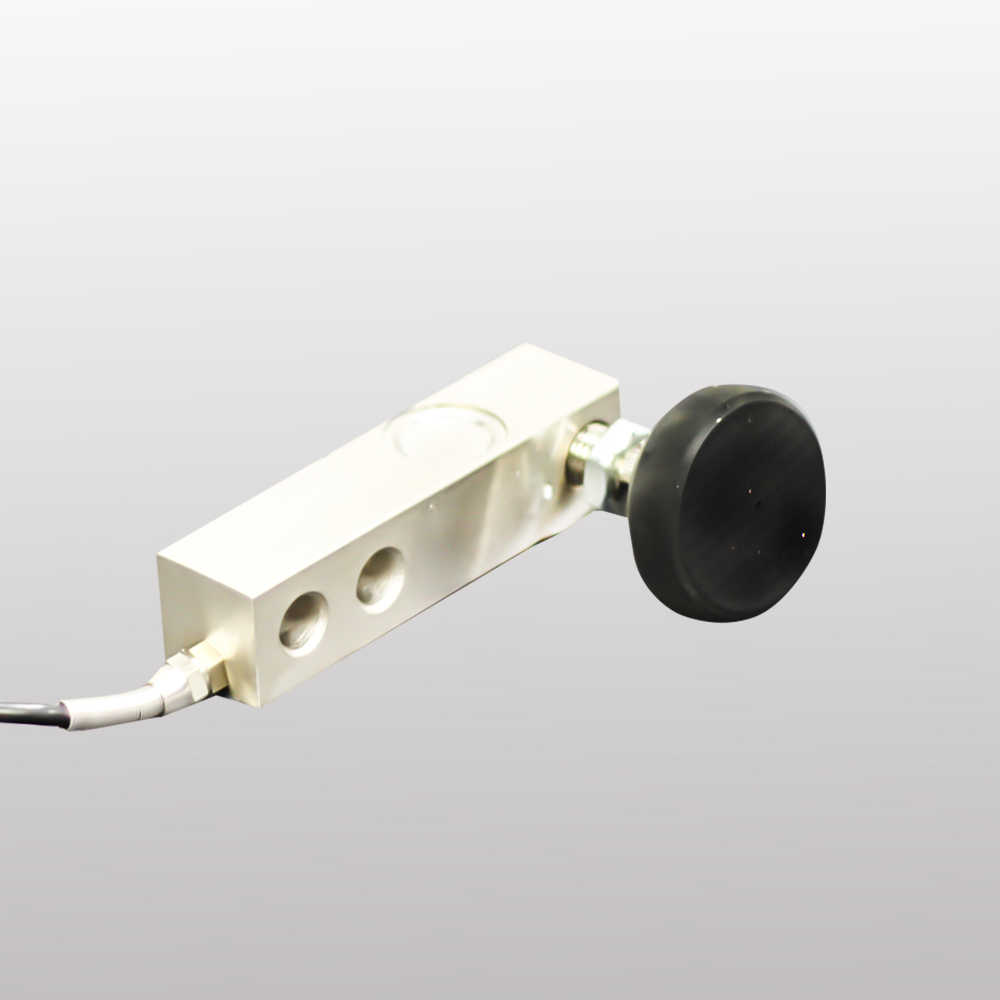
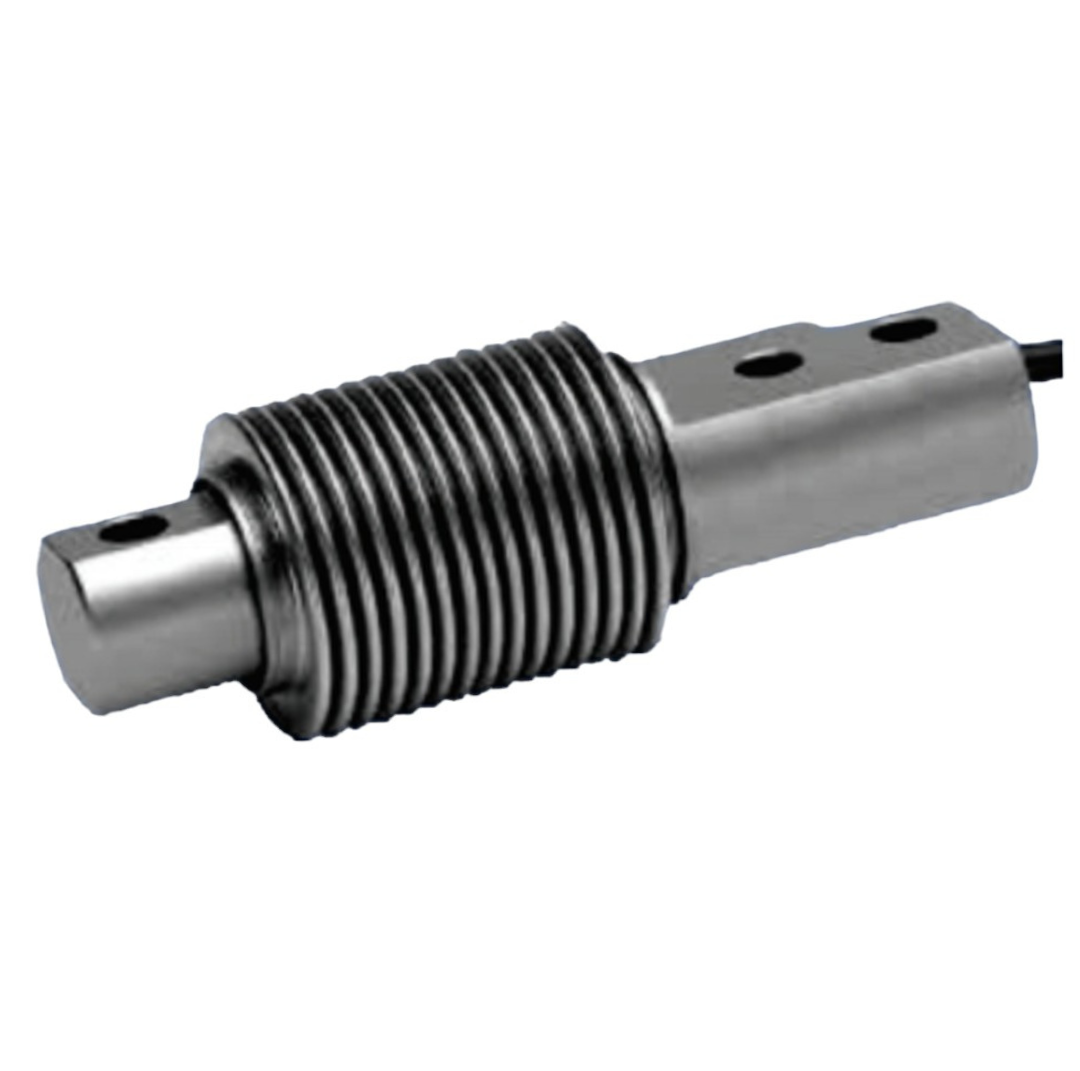
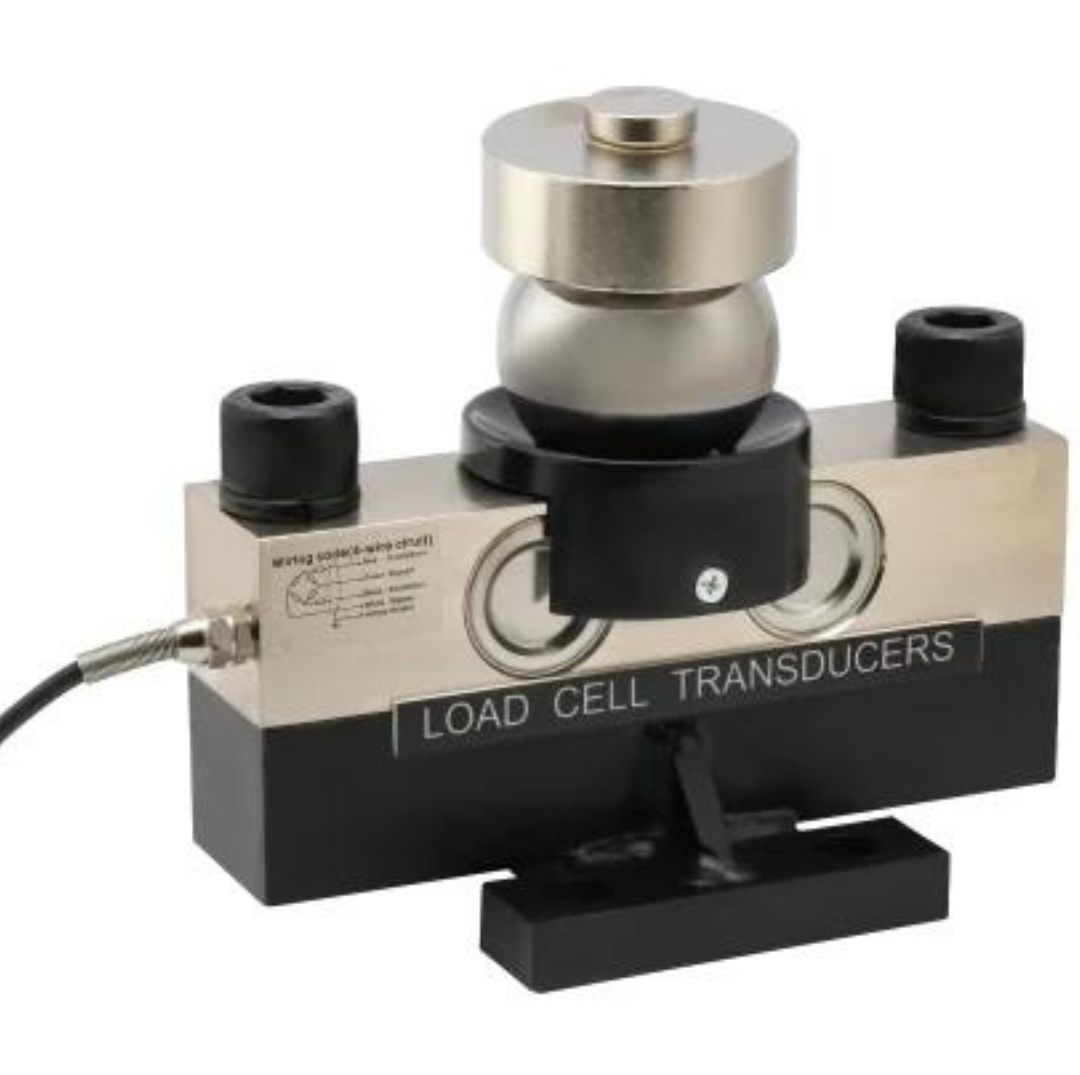
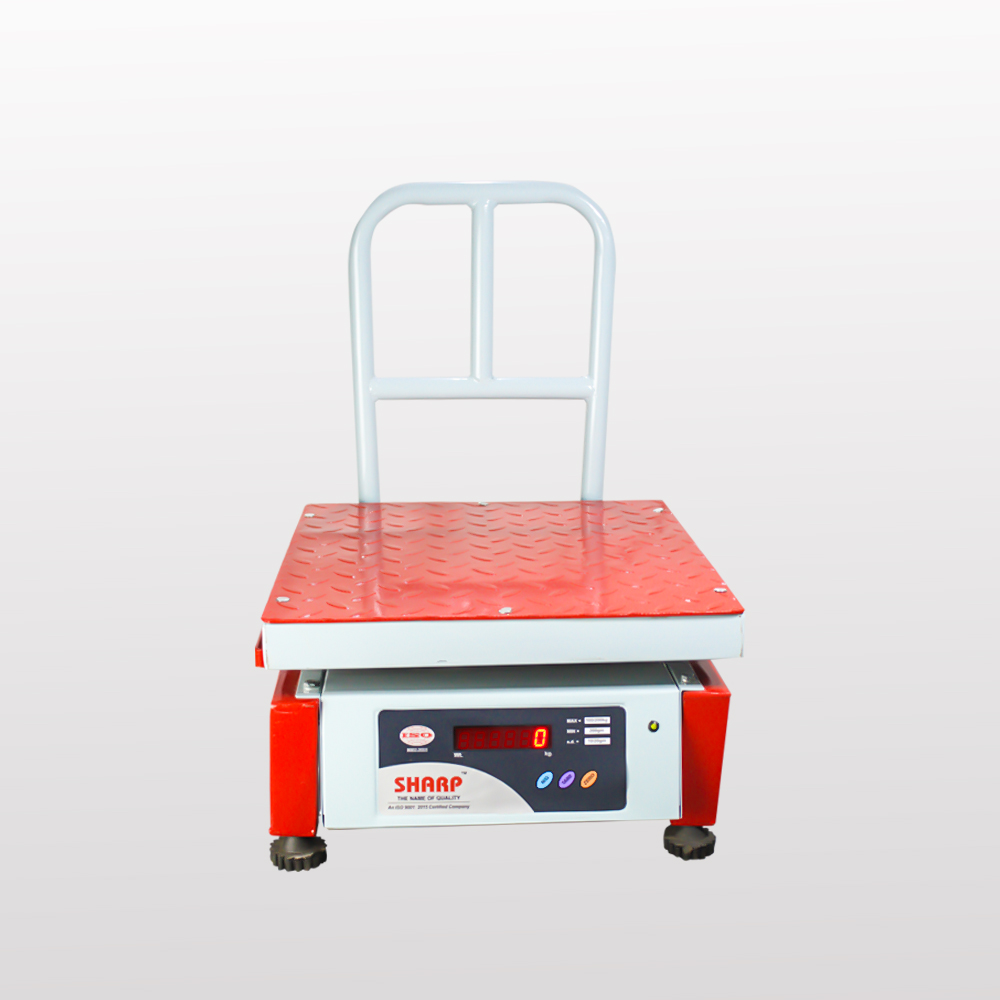
Sharp Electronics, established in 2000, is an ISO 9001:2015 certified organization engaged in the manufacturing and export of high-performance industrial weighing systems. Operating under a partnership firm structure, we specialize in the production or manufacturers of load cell, weighing scale, precision-engineered products, including Tabletop Scales, Platform Scales, Weight Controllers, and customized weighing solutions tailored to industrial and commercial applications.
Our products are extensively deployed in sectors such as retail weighing, agriculture, poultry and fisheries, hardware trading, market yards, and metal industries. With a strong emphasis on accuracy, reliability, and long-term performance, our systems are designed to withstand harsh working environments and deliver consistent output.
Our Products

Services by Sharp Electronics

We are the Best on Weighing Scales
Guarntee 100%
Repair and Service
Products
Machine Refurbishment
Quality Installation
Support And Help
Quick Delivery
Eco Vending
What Our Clients Say About Us

We've relied on Sharp Electronics' platform scales for years. They’re extremely accurate and hold up perfectly in our busy hardware warehouse. Truly a reliable brand!
The weighing systems from Sharp are perfect for our grain and vegetable markets. Rugged, easy to use, and most importantly—accurate even under load.
Sharp Electronics delivered a custom weighing solution that fits right into our production line. Their ISO quality standards show in every unit.
The tabletop scale we use in our retail shop is compact, precise, and easy for staff to operate. Sharp has made day-to-day operations smoother.
Partners
People Who Trust Us